Table of Contents
Introduction to Simple Moving Average
The Simple Moving Average (SMA) is a widely used statistical measure for finance and data analysis. We can calculate the average of a set of data points over a specified period of time while giving equal weight to each data point.
The Simple Moving Average is commonly used by stock traders who perform technical analysis. They use it to identify trends in stock prices, exchange rates and other financial data.
Calculate Simple Moving Average
Formula:
The SMA is calculated using this formula
SMA = Sum of Data points in a period / Number of Data points in the period
Where, Data points are individual values and Period is the number of Data points taken for the calculation.
Steps to calculate SMA
- Choose the time period for your calculation. (e.g., 5 days, 10 days, etc.).
- Add all the values of the data points in the chosen period.
- Divide the sum of values by the total number of data points in the period.
Using Python to Calculate Simple Moving Average in a list
We can calculate Simple Moving Average for a list of data points easily. For this, we will use Pandas library.
import pandas as pd

#Example list of data
my_list1 = [10,21,32,43,54,65,76,87]

#Converting the data into a Pandas Series
data1 = pd.Series(my_list1)

#Calculate the SMA for a window of 3 periods
SMA = data1.rolling(window=3).mean()

#Printing Simple Moving Average
print(SMA)
Output of the above example >>
0     NaN
1     NaN
2    21.0
3    32.0
4    43.0
5    54.0
6    65.0
7    76.0
dtype: float64
The first two period will be Nan because there is no enough data to calculate 3 period SMA.
Plotting the output of SMA
We will now plot the output so it will be easily understandable
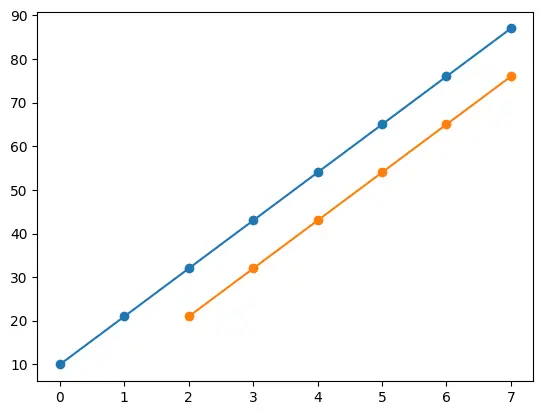
We will plot the output of SMA to a graph with the help of matplotlib library. This will help us understand our data better.
import matplotlib.pyplot as plt
import pandas as pd

#Example list of data
my_list1 = [10,21,32,43,54,65,76,87]

#Converting the data into a Pandas Series
data1 = pd.Series(my_list1)

#Calculate the SMA for a window of 3 periods
SMA = data1.rolling(window=3).mean()

#Plot the original Data and SMA
plt.plot(my_list1, label='Original Data', marker='o')
plt.plot(SMA, label='SMA (3)', marker='o')
plt.show()
Output of the above example >>

Using Python to Calculate Simple Moving Average in a dataframe
We will now calculate Simple Moving Average for a Python dataframe. You can learn more about dataframe from here.
import pandas as pd

data = {
    'Date': ['2024-12-01', '2024-12-02', '2024-12-03', '2024-12-04', '2024-12-05', '2024-12-06'],
    'Price': [10, 12, 14, 16, 18, 20]
}

df = pd.DataFrame(data)

# Convert 'Date' column to datetime (optional, if working with time series data)
df['Date'] = pd.to_datetime(df['Date'])

# Calculate SMA with a window of 3 periods
df['SMA'] = df['Price'].rolling(window=3).mean()

# Print the resulting DataFrame
print(df)
Output of the above example >>
        Date  Price  SMA_3
0 2023-12-01     10    NaN
1 2023-12-02     12    NaN
2 2023-12-03     14   12.0
3 2023-12-04     16   14.0
4 2023-12-05     18   16.0
5 2023-12-06     20   18.0
In this example, the rolling(window=3) Creates a rolling object with a windows size of 3. The first two Data points aren’t enough for calculating SMA and hence there are no data.
mean() calculates the SMA for each window.
Working with Multiple Columns
We have calculated SMA for one column. Now we will see an example of calculating SMA for multiple columns.
import pandas as pd

data = {
    'Date': ['2024-12-01', '2024-12-02', '2024-12-03', '2024-12-04', '2024-12-05', '2024-12-06'],
    'Stock_A': [10, 12, 14, 16, 18, 20],
    'Stock_B': [15, 17, 19, 21, 23, 25]
}

df = pd.DataFrame(data)

# Calculate SMA for both Stock_A and Stock_B with a window of 3
df['SMA_Stock_A'] = df['Stock_A'].rolling(window=3).mean()
df['SMA_Stock_B'] = df['Stock_B'].rolling(window=3).mean()

# Print the resulting DataFrame
print(df)
Output of the above example >>
         Date  Stock_A  Stock_B  SMA_Stock_A  SMA_Stock_B
0  2023-12-01       10       15          NaN          NaN
1  2023-12-02       12       17          NaN          NaN
2  2023-12-03       14       19         12.0         17.0
3  2023-12-04       16       21         14.0         19.0
4  2023-12-05       18       23         16.0         21.0
5  2023-12-06       20       25         18.0         23.0
Plotting the output of SMA
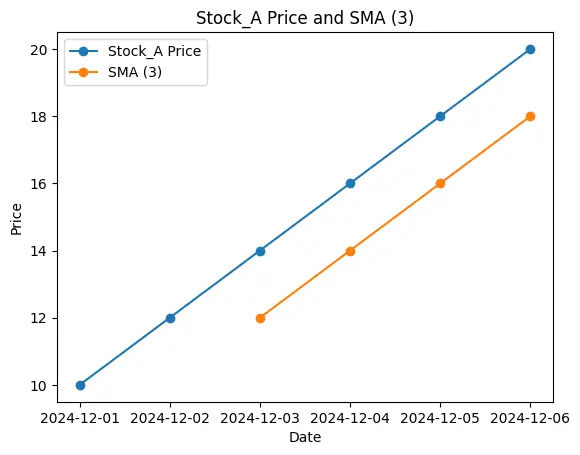
Till here, we have learnt a lot about Simple Moving Average. Now, we will plot the output of SMA with multiple stocks. Remember, you can always choose the data of your choice.
import pandas as pd

data = {
    'Date': ['2024-12-01', '2024-12-02', '2024-12-03', '2024-12-04', '2024-12-05', '2024-12-06'],
    'Stock_A': [10, 12, 14, 16, 18, 20],
    'Stock_B': [15, 17, 19, 21, 23, 25]
}

df = pd.DataFrame(data)

# Calculate SMA for both Stock_A and Stock_B with a window of 3
df['SMA_Stock_A'] = df['Stock_A'].rolling(window=3).mean()
df['SMA_Stock_B'] = df['Stock_B'].rolling(window=3).mean()

# Plot original data and SMA
plt.plot(df['Date'], df['Stock_A'], label='Stock_A Price', marker='o')
plt.plot(df['Date'], df['SMA_Stock_A'], label='SMA (3)', marker='o')

plt.xlabel('Date')
plt.ylabel('Price')
plt.legend()
plt.title('Stock_A Price and SMA (3)')
plt.show()
Output of the above example >>

Thank you for continuing till now, if you have any questions then you can comment us down below. We will reach out to you soon.
Leave a Reply